Surface Modeling For Grade Verification
Engineering Insight: The Civil 3D files given to the client contain all display settings to help the project team understand the surfaces and how grades have been established. -- Aaron Hunt, Lead Technical Manager
Location: Greenway, New York
Task: TruePoint 3D laser scanned four pathways located at Little Island, near Pier 55 at Hudson River Park to generate 2D AutoCAD drawings. The objective of this project was to provide surface modeling to be used for grade verification.
Challenge: Our client needed 3D laser scanning to create 2D drawings in order to verify path slopes were in compliance with handicap access standards.
Solution: Using the Leica P50 ScanStation, TruePoint captured 1,450 square feet of pathway with 72 laser scan setups. Data is captured in a point cloud, more than 261 million points were captured and plotted in a CAD environment, each with a Cartesian coordinate represented by an X, Y, and Z value. This dataset will be used to build the pathways inside AutoCAD Civil 3D 2021. TruePoint engineers will utilize the point cloud and Civil 3D files to calculate and detail grades.
Deliverables: TruePoint delivered 2D AutoCAD plan views of the four pathways showing grade percentages. TruePoint provides native CAD files with the point cloud overlaid. This allows project members to review items extracted alongside actual point cloud data. TIN construction for the files was completed by attaching Coordinate Geometry Points (COGO) directly to the point cloud. COGO points have been added to the TIN at a quantity to establish 1/8” elevation changes, while avoiding debris on the pathways.
Grades and Surface Annotations
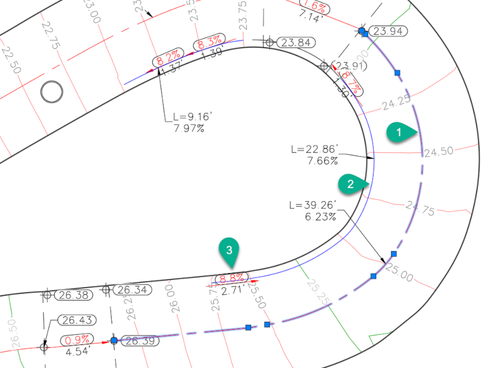
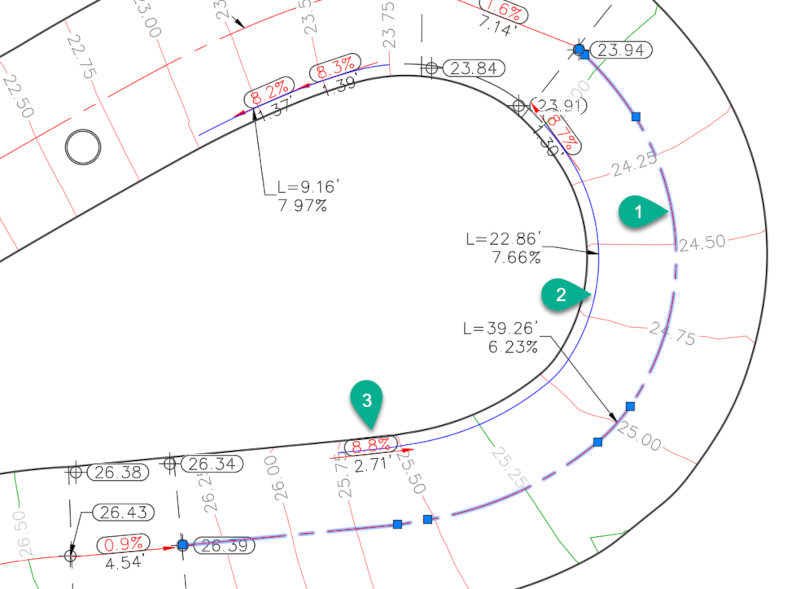
Civil 3D’s TIN surface provides a tool to calculate grade, create contours, and generate 2D sheets. Each pathway was broken down into individual ramps. Three methods for calculating grades were used at each ramp.
- Centerline of ramp grade between landings. This is a function of the differences in end elevations, and centerline length. This does not include any abrupt elevation changes between endpoints.
- Interior curvature grade (blue lines). This is a segment of the ramp representing a faster transition in elevation at a tight radius. Like the centerline of the ramp calculation, this is a function of length and differences at endpoints.
- Localized grades (red arrows). These areas are detailed with arrowheads, grade percentage, and the horizontal distance between elevations sampled.
About Our Client: Little Island at Pier 55 is an artificial island park in the Hudson River, west of Manhattan in New York City, adjoining Hudson River Park.
Disclaimer: Elevations have been estimated only to establish a change in vertical height between points. This project is not intended to tie into land survey that may have been used for construction.
For More Information: TruePoint is experienced in checking construction surfaces with grade verification points. For more information on surface modeling for grade verification, email info@truepointscanning.com or call 419-843-7226.
3D Laser Scanning in New York: For 3D laser scanning services in New York, email newyork@truepointscanning.com or call 646-430-2444.
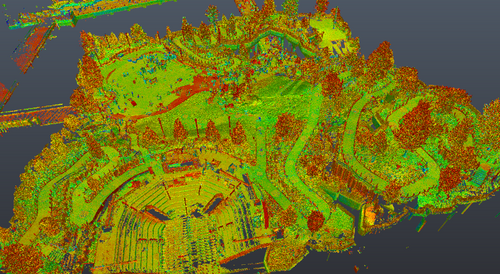
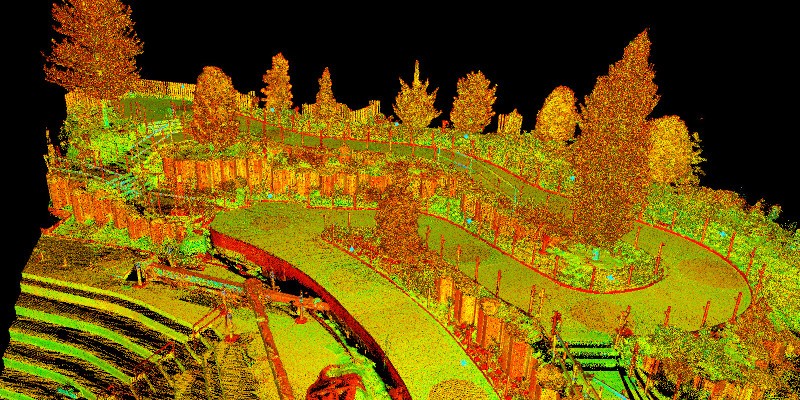
Intensity map point cloud data plotted in Autodesk Recap
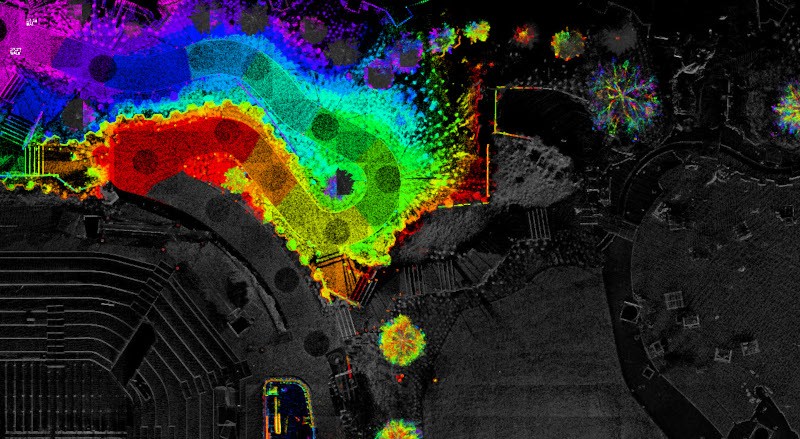
Civil 3D screenshot of color by elevation.
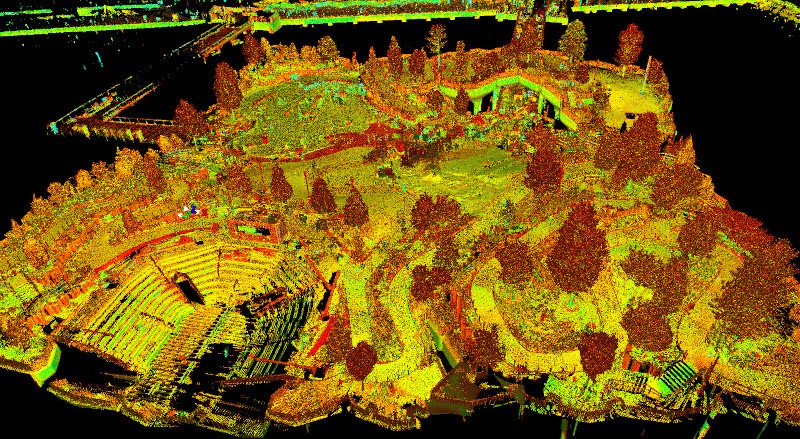
Intensity map point cloud data plotted in Autodesk Recap of path 1 isolated.
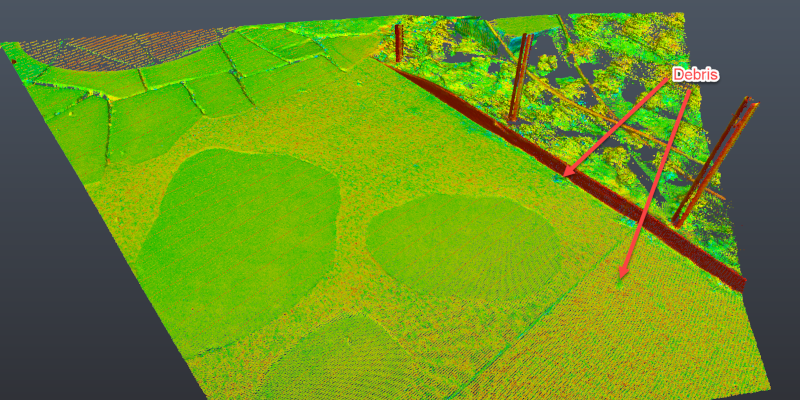
Autodesk Recap screenshot showing changes in texture and debris. This is only seen in the point cloud.
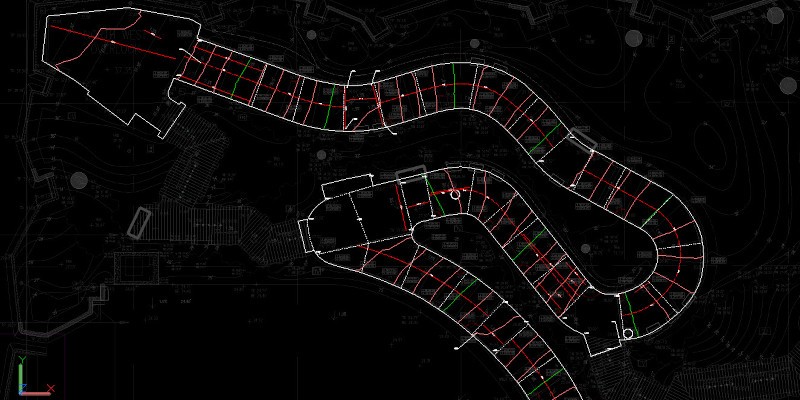
Plan view of Path 1 in Civil 3D.
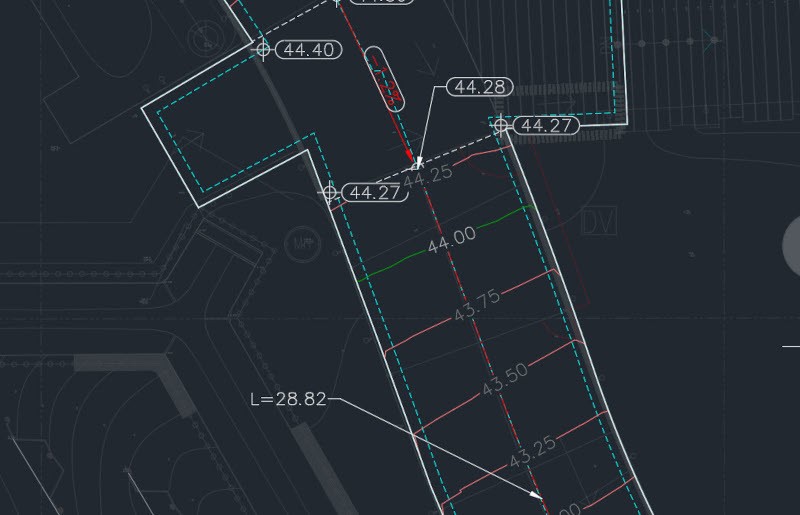
Enlarged view of the pathway in AutoCAD.
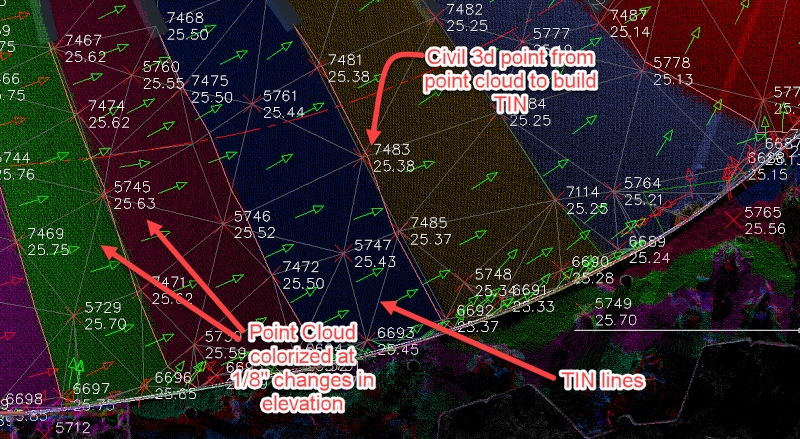
This screenshot shows the Civil 3D files with more stringent criteria displays active. Color variation of the point cloud is based on 1/8” changes in elevations of the points.
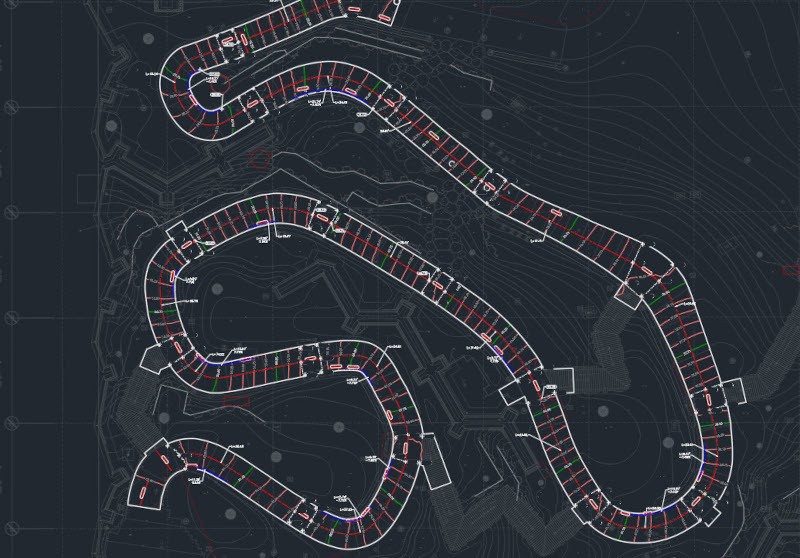
Plan view overall AutoCAD contours.
Civil 3D’s TIN surface provides a tool to calculate grade, create contours, and generate 2D sheets. Each pathway was broken down into individual ramps. Three methods for calculating grades were used at each ramp.
